Your company is only as good as the weakest link. If there is a department or individual holding the team back the entire company will falter (or, at the very least, underperform). Sometimes it isn’t possible to identify where there is unnecessary slack or issues within your business without digging a bit deeper into performance and productivity. With any department, you have analytical data to utilize when determining how well it is doing. You need to use similar data to measure team effectiveness. That is why you need to consider using these different metrics to measure team productivity.
And it’s important to note that these metrics are important for any type of employee on your team. Including independent contractors and both exempt and non-exempt employees, but you do have to measure one important metric different in that case. Be sure to read about exempt vs non exempt employees for this important distinction.
The Importance of Using Team Metrics
You may wonder why you should utilize metrics in measuring the productivity of the business and individual employees. After all, if the company is already performing well, why change what’s already working?
In almost all instances, no matter how finely tuned a business is, there are always ways to improve. Even a slight boost in productivity by a handful of employees can result in an extensive and sustainable boost in your company’s bottom line, which in turn you can invest back into the company.
Productivity metrics can also help you with uncovering where different employees thrive. Some employees might perform better doing certain activities while others might struggle in these roles. By utilizing a productivity metric you can find better positions for each employee.
If an employee is good at what they’re doing they are more likely to be happy with their line of work, which in turn boosts their productivity even further. All of that is why you need to take advantages of these different ways to measure team performance.
Monitor Time Spent On Daily Tasks
To start, you need to monitor the amount of time an employee spends on tasks during the average day. For the average business, this may be broken down into checking and answering emails, gathering information, job-specific tasks and communicating internally.
According to Dynamic Signal, just 39 percent of the average workday is focused on tasks specific to the job title. The other 61 percent of the job involves the checking email, meeting with other employees and gathering information. In fact, 28 percent of the time is spent reading and answering emails. Employees who are spending this much time in their email accounts or trying to track down files from another department represents a substantial loss of time.
(Source)
Research conducted by The McKinsey Global Institute indicates it’s possible to boost productivity across the board by 20 to 25 percent by improving connectivity within the company. This way, employees can ask other employees questions through an internal instant messenger service or request files from inside the company’s network, instead of walking over to the other department.
Implementing a new internal method of communication doesn’t require a substantial monetary investment, but it does help recover potentially 25 percent of the average employee’s time, boosting their productivity.
Is The Juice Worth The Squeeze
One question you’ll need to answer is whether the amount your paying labor productivity is worth the worth of goods you’re selling. While there are other variables you’ll need to consider when it comes to this, there is an easy metric to determine the labor productivity based on price.
As Smartsheet points out, you’ll want to divide the total output by total input to determine the labor productivity. For example, this would take the total worth of goods sold in a given week and divide it by the total employee hours spent. This gives the average cost per hour to produce the goods.
In the example below, a company sells $80,000 worth of goods while spending 1,500 employee work hours to sell the goods, which costs the company $53 per each hour of work.
It is also possible to determine how much each employee is costing the business, by dividing the value of goods by the number of employees. This will give the value per employee per week. If the value per employee is under what the average weekly salary for an employee is, it can point to potential monetary problems for the company and adjustments need to be made.
The Cost of Overtime
Employee overtime may show initiative for a worker. It also represents an increase a substantial increase in payments as an employee may be due time and a half for those hours. For non-salary workers, this can really add up, both for the worker and for the company.
In certain instances, overtime cannot be avoided. During busy sales times of the year (such as during the holidays), employees may be forced to work additional hours. That’s to be expected. There may also be a shortage in staff members, which is a sign you need to hire on more employees. A new worker will likely start out earning less, especially if current workers are making one and a half times the standard wage.
You need to stay on top of overtime and measure it with sales. If overtime increases with the number of sales it’s one thing, but if there is an increase in overtime without a shift of sales along with it, it indicates you may have some employees who are giving away shifts or the same person who is taking up all the additional work. It shows a great initiative, but there are other ways to reward such an individual than to pull revenue from the business.
According to Datapine (2018), individuals between the ages of 26 and 35 are more likely to work extra hours a week. You need to monitor the overtime wages on a weekly bases so you have a threshold to compare it to. This way, you can look at overtime trends, both over a short period of time and by comparing it to previous years.
(Source)
Having this information will help you make the needed adjustments. It also shows who is willing to put in the work and who may be a prime candidate for a manager or higher, salary raise (in which case, moving someone from hourly to salary may actually save the company money).
Team Turnover Rate
One of the biggest hinders to the bottom line of your business is the turnover rate. The lower turnover rate the better. When someone leaves it means you need to bring someone else on, train them and educate them on how to work inside of your business. This drains the productivity of other employees as they spend their time working to train these new workers.
According to Business Daily Pay (2017), the federal government has the lowest turnover rate at 1.3 percent, while state and local education government positions sit slightly higher at 1.4 percent. However, other industries have a much higher turnover rate.
The hospitality industry of hotels sees an annual turnover rate between 60 and 300 percent, while supermarkets and fast food both see around a 100 percent turnover rate. Retail has a 59 percent turnover rate.
In some instances, especially those with high turnover rates, it’s because the jobs are not career based and many take the positions to springboard themselves to a new job, so a high turnover rate is to be expected.
However, if your business has a high turnover rate and you’re not in a fast food or hospitality business, there is likely another issue at play. Satisfied workers are less likely to leave, which means you’re either not paying them well enough or offering the right kind of compensation. As Business Daily Pay points out, you may not be providing adequate training, which means the employee is not satisfied with the kind of work they are able to give.
Data Pine points out the average turnover rate by age group. The highest are those younger than 25, with both the voluntary and involuntary loss numbers going down as the age increases (until employees reach the age of retirement, in which case the numbers begin to jump back up).
(Source)
One of the most valuable productivity metrics is whether your employees are sticking around or not. It’s also one of the biggest expenses for your business. You will boost productivity and cut down on unnecessary expenses.
Sales Staff Numbers
If you are in retail you understand how important sales is to your business. While the other departments help gain attention and increase exposure, sales drive everything else and bring in money for the company. Due to this, you need to use a productivity metric for sales within the company. This way, you can see what employees are improving, which are struggling, and maybe which employee fairs better with specific products or demographics.
As is the case with improving your website and marketing, data is critical. The more data you have access to the better off you’ll be and the easier it becomes to boost sales. With the analytical data and customer demographics you’ll uncover who’s buying what and, from there, you can determine which staff member generates the highest level of these sales. Using the data, you’re able to shift which of your staff members works with the key demographics best.
Data Pine points out it is important to compare the staff members with each other while measuring sales metrics. This includes monthly sales numbers while comparing these numbers to the previous year. While there is always going to be a top and bottom sales professional, as long as they are increasing their numbers on an annual basis it points to the continued development.
(Source)
Objective Management
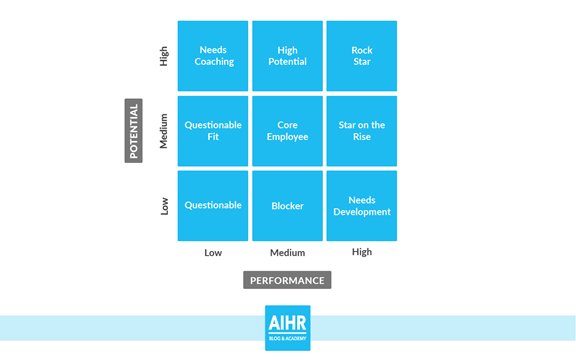
A successful business owner has the ability to evaluate employees fairly and determine whether they are going to be a continued proper fit with the business, or if it is better off to let the individual go. However, sometimes putting this employee evaluation into a productivity metric is difficult. This is where the Potential vs. Performance scale comes in. It allows HR and other management professionals the ability to rate an employee’s ability both on their current performance, and on the potential the employee brings.
Sometimes those who are struggling currently have all the potential in the world, all it takes is some coaching and assistance. As Analytics In HR points out, by using the nine-box grid (seen below), it is possible to determine both the current and future value of an employee, which is beneficial should a promotion come up, or if it proves necessary to let an employee go.

(Source)
In Conclusion
Employee productivity is critical to the overall wellbeing of the business. It also can point out where an employee is struggling or if the company is making enough money per employee. By using these kinds of productivity metrics it becomes easier to identify where the business needs to improve or shifts that need to be made. From here, it becomes possible to boost productivity and, most importantly, the company’s bottom line.


